Find Nearest Neighbors Using a Custom Distance Metric
This example shows how to find the indices of the three nearest observations in X to each observation in Y with respect to the chi-square distance. This distance metric is used in correspondence analysis, particularly in ecological applications.
Randomly generate normally distributed data into two matrices. The number of rows can vary, but the number of columns must be equal. This example uses 2-D data for plotting.
rng(1) % For reproducibility
X = randn(50,2);
Y = randn(4,2);

h = zeros(3,1);
figure
h(1) = plot(X(:,1),X(:,2),'bx');
hold on
h(2) = plot(Y(:,1),Y(:,2),'rs','MarkerSize',10);
title('Heterogeneous Data')
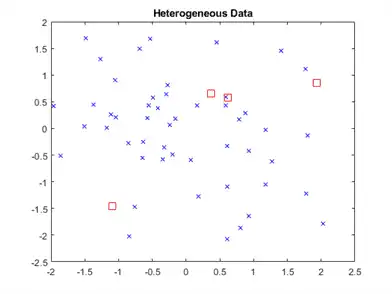
The rows of X and Y correspond to observations, and the columns are, in general, dimensions (for example, predictors).
The chi-square distance between j-dimensional points x and z is
χ(x,z)=GJ?j=1wj(xj−zj)2,
where wj is the weight associated with dimension j.
Choose weights for each dimension, and specify the chi-square distance function. The distance function must:
-
Take as input arguments one row of
X, e.g.,x, and the matrixZ. -
Compare
xto each row ofZ. -
Return a vector
Dof length nz, where nz is the number of rows ofZ. Each element ofDis the distance between the observation corresponding toxand the observations corresponding to each row ofZ.
w = [0.4; 0.6];
chiSqrDist = @(x,Z)sqrt((bsxfun(@minus,x,Z).^2)*w);
This example uses arbitrary weights for illustration.
Find the indices of the three nearest observations in X to each observation in Y.
k = 3;
[Idx,D] = knnsearch(X,Y,'Distance',chiSqrDist,'k',k);
idx and D are 4-by-3 matrices.
-
idx(j,1)is the row index of the closest observation inXto observation j ofY, andD(j,1)is their distance. -
idx(j,2)is the row index of the next closest observation inXto observation j ofY, andD(j,2)is their distance. -
And so on.
Identify the nearest observations in the plot.
for j = 1:k
    h(3) = plot(X(Idx(:,j),1),X(Idx(:,j),2),'ko','MarkerSize',10);
end
legend(h,{'\texttt{X}','\texttt{Y}','Nearest Neighbor'},'Interpreter','latex')
title('Heterogeneous Data and Nearest Neighbors')
hold off
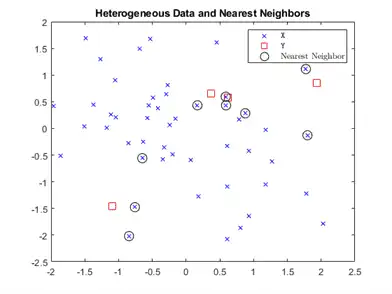
Several observations of Y share nearest neighbors.
Verify that the chi-square distance metric is equivalent to the Euclidean distance metric, but with an optional scaling parameter.
[IdxE,DE] = knnsearch(X,Y,'Distance','seuclidean','k',k, ...
    'Scale',1./(sqrt(w)));
AreDiffIdx = sum(sum(Idx ~= IdxE))
AreDiffIdx = 0
AreDiffDist = sum(sum(abs(D - DE) > eps))
AreDiffDist = 0
The indices and distances between the two implementations of three nearest neighbors are practically equivalent.
K-Nearest Neighbor Classification for Supervised Learning
The ClassificationKNN classification model lets you:
Prepare your data for classification according to the procedure in Steps in Supervised Learning. Then, construct the classifier using fitcknn.
Construct KNN Classifier
This example shows how to construct a k-nearest neighbor classifier for the Fisher iris data.
Load the Fisher iris data.
load fisheriris
X = meas;    % Use all data for fitting
Y = species; % Response data
Construct the classifier using fitcknn.
Mdl = fitcknn(X,Y)
Mdl =
  ClassificationKNN
             ResponseName: 'Y'
    CategoricalPredictors: []
               ClassNames: {'setosa'  'versicolor'  'virginica'}
           ScoreTransform: 'none'
          NumObservations: 150
                 Distance: 'euclidean'
             NumNeighbors: 1


  Properties, Methods
A default k-nearest neighbor classifier uses a single nearest neighbor only. Often, a classifier is more robust with more neighbors than that.
Change the neighborhood size of Mdl to 4, meaning that Mdl classifies using the four nearest neighbors.
Mdl.NumNeighbors = 4;