How to import data with titles and plot on a plane ?

I have droplet diameter and coordinates in a CSV file and I want to draw the all these points in 3d space and later project them on a 2D plane. can someone suggest how can I read this data. Thanks in advance. I'm interested only in droplet diameter and it's coordinates.
 Kshitij Singh answered .
2025-11-20
Kshitij Singh answered .
2025-11-20
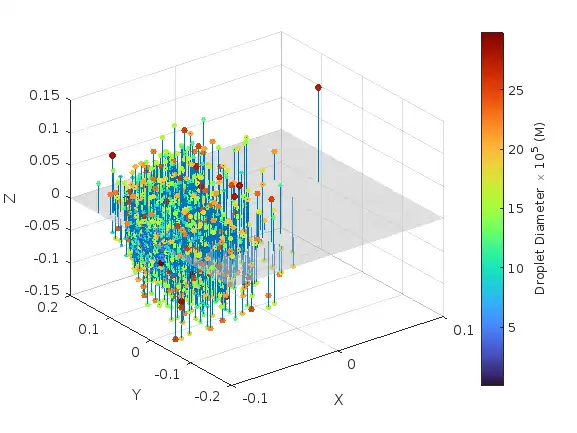
I am not exactly certain what you want. One way of plotting them in 3D and also projecting them on a plane is to combine a stem3 plot and a scatter3 plot —
Uz = unzip('data.zip');
% fc = fileread(Uz{1})
fidi = fopen(Uz{1},'rt');
k = 1;
while ~feof(fidi) & (k<=10)
    rl{k,:} = fgetl(fidi);
    k = k+1;
end
fclose(fidi);
VN = strsplit(rl{4}, ' ');
droplets = readtable(Uz{1}, 'FileType','text', 'HeaderLines',5);
droplets.Properties.VariableNames = VN(2:end-1)
droplets = 4670×20 table
    TIME     X-Coord      Y-Coord      Z-Coord       Diameter     Density     U-Velo       V-Velo       W-Velo        UT-Velo       VT-Velo        WT-Velo      Temperatur    Life_Time     Weber_No     Stokes_No     Ident    Nozzle    Proc    Imping
    ____    _________    _________    __________    __________    _______    _________    _________    _________    ___________    __________    ___________    __________    _________    __________    __________    _____    ______    ____    ______

    0.05    -0.090385    -0.032003     0.0081542    3.4145e-05    959.89     -0.031454    -0.038965     0.013472     -0.0041884    -0.0013082       0.002092      373.15        0.045      7.6791e-07      0.033496     3448      1        7        0
    0.05    -0.091358     -0.03418      0.015947    3.6409e-05    959.89     -0.048048    -0.024729     0.016297     -0.0023005    -0.0014205    -0.00089046      373.15       0.0445      1.1324e-06    0.00046301     4065      1        7        0
    0.05    -0.095208    -0.030039    -0.0036156    4.1337e-05    959.89     -0.027739    -0.090139    -0.030527       0.022442     -0.021859      0.0024811      373.15       0.0405      2.1372e-06       0.34806     9022      1        7        0
    0.05    -0.095018    -0.040921      0.020399    4.6496e-05    959.89     -0.079326    -0.031016     0.016833      0.0010701    -0.0014528      0.0018666      373.15        0.045       3.397e-06     0.0010893     3546      1        7        0
    0.05    -0.084277    -0.045149     0.0052363     5.266e-05    959.89     -0.075503    -0.059956    0.0044079    -0.00036266    -0.0015555      0.0017451      373.15        0.045      4.3691e-06    0.00056493     3396      1        7        0
    0.05    -0.095041    -0.038119     -0.027047    7.8739e-05    959.89     -0.074046      -0.2798     -0.22825      -0.001181     0.0013092     -0.0007613      373.15       0.0355      0.00010153     0.0026183    11904      1        7        0
    0.05    -0.093338    -0.034883      0.022804    5.1174e-05    959.89     -0.075775    -0.057902     0.049309    -0.00028933     0.0017213      0.0013845      373.15       0.0395      5.1543e-06    0.00062802     9929      1        7        0
    0.05    -0.090707    -0.057069    -0.0059532     5.417e-05    959.89     -0.088391    -0.071006    -0.013249     0.00022564     0.0013297    -0.00069184      373.15       0.0435      7.0252e-06    0.00037145     5231      1        7        0
    0.05    -0.095023    -0.052208    -0.0054762    5.8263e-05    959.89      -0.10234    -0.094789    -0.013927    -0.00076917    0.00018328     0.00095466      373.15       0.0445      1.0662e-05     0.0093345     4165      1        7        0
    0.05    -0.089498    -0.035614      0.044709    0.00013526    959.89     -0.014238     -0.41357      0.61117     0.00063334    0.00078877     0.00083319      373.15        0.041      0.00074065     0.0022664     8373      1        7        0
    0.05    -0.091463    -0.031236      0.010759    4.5083e-05    959.89     -0.053295      -0.0458     0.020416      0.0003124     0.0058428    -0.00058846      373.15        0.045      2.3234e-06       0.10925     3510      1        7        0
    0.05     -0.08727    -0.036753     0.0073399    4.3337e-05    959.89     -0.054384    -0.031757    0.0052104    -0.00040866     0.0016526     -0.0001831      373.15       0.0435       2.193e-06    0.00071105     5235      1        7        0
    0.05    -0.078492    -0.045156     -0.014288    5.0382e-05    959.89     -0.068305    -0.039995    -0.012197      0.0013146    -0.0024517     -0.0018704      373.15        0.045      3.5571e-06    0.00043666     3481      1        7        0
    0.05     -0.09666    -0.029865      0.009483    3.4918e-05    959.89     -0.042103    -0.066528     0.022839      0.0021231     -0.014508      0.0011205      373.15       0.0445      8.4588e-07       0.24043     4038      1        7        0
    0.05    -0.081006    -0.047258      -0.01738    0.00020125    959.89       0.18871      -0.6734     -0.35412     0.00011428     0.0003534     0.00036473      373.15       0.0405       0.0012263     0.0071006     8892      1        7        0
    0.05    -0.090334    -0.038719     0.0077356    4.1019e-05    959.89      -0.05426     -0.03206     0.011038     0.00036701     0.0011375     0.00016516      373.15        0.044      1.8421e-06    0.00049352     4670      1        7        0
figure
stem3(droplets.('X-Coord'), droplets.('Y-Coord'), droplets.('Z-Coord'), 'Marker','none')
hold on
scatter3(droplets.('X-Coord'), droplets.('Y-Coord'), droplets.('Z-Coord'), droplets.Diameter*1E5, droplets.Diameter*1E5, 'filled')
patch([xlim flip(xlim)], [[1 1]*min(ylim) [1 1]*max(ylim)], zeros(1,4), [1 1 1]*0.75, 'FaceAlpha',0.5, 'EdgeColor','none')
hold off
colormap(turbo)
xlabel('X')
ylabel('Y')
zlabel('Z')
hcb = colorbar;
hcb.Label.String = 'Droplet Diameter \times 10^5 (M)';