Question
need to generate a synthetic dataset using a distribution that is not supported by the Matlab stats toolbox. The distribution is a Type II Pareto (or Lomax) with the probability density function f ( x ) = ( a m^a) / ( m + x )^( 1 + a ), where a is a shape parameter and m is the minimum permissible value of x. The distribution also needs to be truncated at x=50. Is it possible to generate a probability distribution object (pd) from an equation or PDF, so that I can then use the "random" function to create the synthetic dataset? Or any other way to do this? Right now, I'm using "randsample" to do this, but that imposes a finite range or truncation on the PDF since it's an array.
Expert Answer

John Michell
PhD Expert
Answered Oct 22, 2026
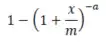
You will need the inverse of the Cumulative Distribution Function. The Lomax CDF is given by Wikipedia as
The inverse function gives the x value corresponding to a given cumulative probability r as
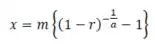
The code below shows how to draw samples from the Lomax PDF. The resulting distribution is compared to the analytical PDF for verification.
% Lomax PDF parameters:
m = 1;
a = 2;
% Draw random samples from uniform distribution in range 0 to 1:
n_samples = 100000;
r = rand(n_samples,1);
% Find the CDF values corresponding to the samples
x = m*((1 - r).^(-1/a)-1);  % Inverse Lomax CDF

% Calculate histogram with bin width 0.1:
binwidth = 0.1;
bins = 0:0.1:5;
N = histcounts(x,bins);  % Number of x values in each bin
f = N/n_samples/binwidth; % Observed frequency per x unit
bin_centres = (bins(1:end-1)+bins(2:end))/2;''
figure;
bar(bin_centres,f)

% Compare with analytic pdf
x = 0.05:0.1:4.95;
p = a/m*(1+x/m).^-(a+1);   %Lomax PDF
hold on;
h = plot(x,p,'ok');  % Plot the PDF using circles
set(h,'MarkerFaceColor','w')
hold off
str = sprintf('Lomax PDF, m = %3.1f, a = %3.1f',m,a);
title(str)
legend('Sampled','Analytical')
100% Run Guarantee
3-Hour Fast-Track Delivery
Need a Custom Version or Complete Simulation for This Problem?
Our 500+ PhD engineers build, debug, and optimize working MATLAB scripts and Simulink (.slx) models tailored to your exact assignment rubrics with zero plagiarism.
Tested on MATLAB R2024b / R2026a
Turnitin 0% Plagiarism Report
Free 7-Day Revisions Guarantee
Have a different question? Ask here
Related distribution Questions & Solutions
Browse All →
Explore similar technical troubleshooting questions and verified MATLAB solutions:
Ready-to-Run MATLAB & Simulink Projects
Browse All Projects →