I have curve fitted an histogram using the gaussian function

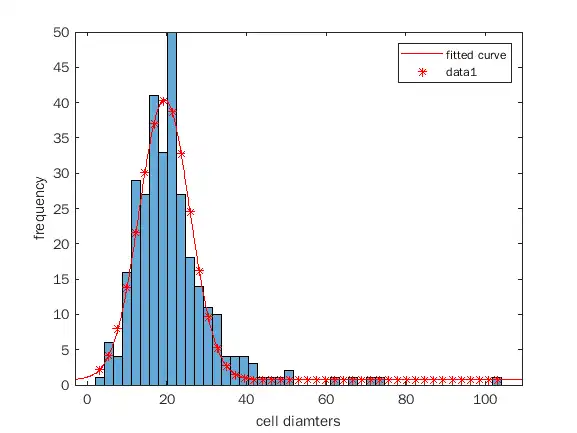
Hi, I have curve fitted an histogram using the gaussian function. Now I would like to know how to extract a series of cell diameters from the gaussian fit. Histogram with curve fit (x = cell diamters y = frequency)
 Prashant Kumar answered .
2025-11-20
Prashant Kumar answered .
2025-11-20
Check The Code:
clc; clear all; close all;
BW = imread('../resources/images/gaussianfitqa3.webp');
[nr,nc,layers] = size(BW);
%% converting the image to 2d so the image can be labledd %%
if layers>1
BW = BW(:,:,1);
end
% end of lablling %%%%%%%%%%%%%%%%%
binaryimage = BW < 128;
bw = logical(binaryimage);
imwrite(bw, 'imagetoapp.jpg');
%% lablelling the image %%%%%%
[labeledimage, numberofblobs] = bwlabel(binaryimage,8);
props = regionprops(labeledimage, 'Equivdiameter');
x = numel(props);
y = zeros(x,1);
for i = 1:1:length(props)
y(i,1) = struct2array(props(i,1));
end
%%%%%%%%%%%%%%%%%%%%%%%%%%%%%%%%%%%%%%%%%%%%%%%%%%%%%%%%%%
%% LAbled image to rgb
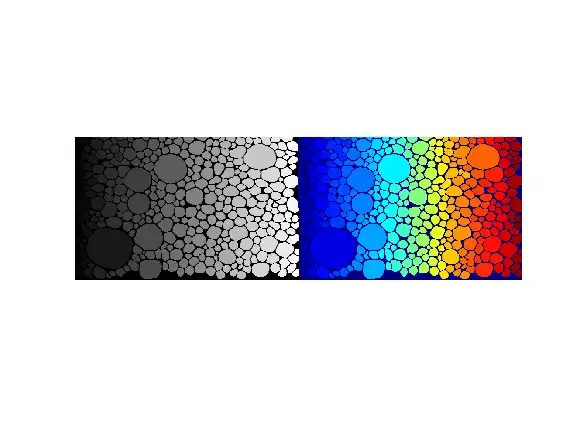
colouredimage = label2rgb(labeledimage,'jet', [0,0,0.5]);
coloredLabelsImage = label2rgb (labeledimage, 'jet', 'k', 'shuffle');
imshowpair(labeledimage,colouredimage,'montage')
hold on
%% generating histogram and curve fitting it using gaussian function%%%%%%%%%
figure()
y1 = histogram(y,45);
values = y1.Values;
a=y1.BinEdges;
for i = 1 : length(a)-1
b(i) = mean(a(i:i+1));
end
[barheights, position] = hist(y,45);
positiontranspose = position';
valuestranspose = values';
gauss = 'd + a*exp(-(1/2)*((x-b)/c)^2)'
startpoints = [40 20 10 0.5];
myfit = fit(positiontranspose,valuestranspose,gauss,'start',startpoints);
hold on
plot(myfit)
z(:,1) = myfit(x);
zt=myfit(b);
%% plot properties
xlabel('cell diamters')
ylabel('frequency')
hold on; plot(b, zt, 'r*')
%%%%%%%%%%%%%%%%%%%%%%%%%%%%%%%%%%%%%%%%%%%%%%%
%%
%% generating histogram and curve fitting it using gaussian function%%%%%%%%%
figure()
y1 = histogram(y,45);
values = y1.Values;
a=y1.BinEdges;
for i = 1 : length(a)-1
    b(i) = mean(a(i:i+1));
end
[barheights, position] = hist(y,45);
positiontranspose = position';
valuestranspose = values';
gauss = 'd +  a*exp(-(1/2)*((x-b)/c)^2)'
gauss = 'd + a*exp(-(1/2)*((x-b)/c)^2)'
startpoints = [40 20 10 0.5];
myfit = fit(positiontranspose,valuestranspose,gauss,'start',startpoints);
hold on
plot(myfit)
z(:,1) = myfit(x);
zt=myfit(b);
%%  plot properties
xlabel('cell diamters')
ylabel('frequency')
hold on; plot(b, zt, 'r*')
%%%%%%%%%%%%%%%%%%%%%%%%%%%%%%%%%%%%%%%%%%%%%%%
%%