Question
I have a function that displays the countries of the world on a global plot and I need to know how to plot lines of lat and lon in even increments of 10 degrees onto this global plot without using the geoshow command found in the mapping toolbox.
Expert Answer

Prashant Kumar
PhD Expert
Answered Oct 20, 2026
You can do this easily with the standard matlab function sph2cart. Treat the lines of latitude and longitude separately like this:
R = 6371; % earth radius in km
latspacing = 10;
lonspacing = 20;

% lines of longitude:
[lon1,lat1] = meshgrid(-180:lonspacing:180,linspace(-90,90,300));
[x1,y1,z1] = sph2cart(lon1*pi/180,lat1*pi/180,R);
plot3(x1,y1,z1,'-','color',0.5*[1 1 1])

hold on

% lines of latitude:
[lat2,lon2] = meshgrid(-90:latspacing:90,linspace(-180,180,300));
[x2,y2,z2] = sph2cart(lon2*pi/180,lat2*pi/180,R);
plot3(x2,y2,z2,'-','color',0.5*[1 1 1])

axis equal tight off
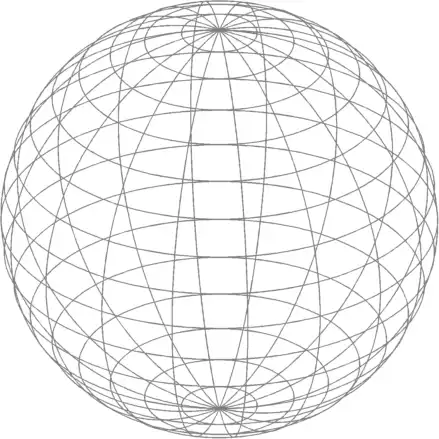
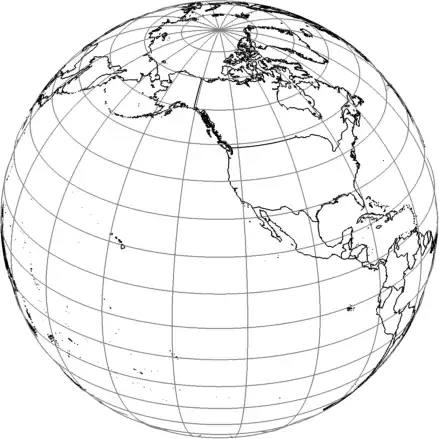
And since you can see all the way through the globe, perhaps you want to put an opaque sphere inside the globe. Do that like this. I'm making the sphere 0.99 times the size of the Earth just to make sure it doesn't overlap the lines of lat and lon:
[X,Y,Z] = sphere(100);
surf(X*R*.99,Y*R*.99,Z*R*.99,'facecolor','w','edgecolor','none')

For a little context, I'll also convert national borders to cartesian coordinates in the same way. You'll need the data from my borders function for this part:
C = load('borderdata.mat');
for k = 1:246
   [xtmp,ytmp,ztmp] = sph2cart(deg2rad(C.lon{k}),deg2rad(C.lat{k}),R);
   plot3(xtmp,ytmp,ztmp,'k')
end
100% Run Guarantee
3-Hour Fast-Track Delivery
Need a Custom Version or Complete Simulation for This Problem?
Our 500+ PhD engineers build, debug, and optimize working MATLAB scripts and Simulink (.slx) models tailored to your exact assignment rubrics with zero plagiarism.
Tested on MATLAB R2024b / R2026a
Turnitin 0% Plagiarism Report
Free 7-Day Revisions Guarantee
Have a different question? Ask here
Related plot Questions & Solutions
Browse All →
Explore similar technical troubleshooting questions and verified MATLAB solutions:
Ready-to-Run MATLAB & Simulink Projects
Browse All Projects →