chandana munnangi asked . 2024-08-30

How to plot multiple graphs in one figure ?

I have two codes. Each code has four graphs. I want to plot two graphs in one figure. For example: Dead nodes vs Round graph of two should be in one figure. In the same way other graphs also. I tried hold on function but still not getting. How to merge the two codes in order to get the graphs ?

Code 1:

clc
clear all;
close all;
xm=100;
ym=100;
x=0;
y=0;
sink.x=0.5*xm;  %location of sink on x-axis
sink.y=0.9*ym;  %location of sink on y-axis
n=100  %nodes
P=0.1 ;  %probability of cluster heads
Eo=0.5; %initial energy
ETX=50*0.000000001;  %tx energy
ERX=50*0.000000001;  %rx energy
Efs=10*0.000000000001;  %free space loss
Emp=0.0013*0.000000000001;   %multi path loss
%Data Aggregation Energy
EDA=5*0.000000001;  %compression energy
a=1;   %fraction of energy enhancment of advance nodes
rmax=3000  %maximum number of rounds
do=sqrt(Efs/Emp);  %distance do is measured
Et=0;  %variable just use below 
A=0;
for i=1:1:n
    S(i).xd=rand(1,1)*xm;  %generates a random no. use to randomly distibutes nodes on x axis
    XR(i)=S(i).xd;
    S(i).yd=rand(1,1)*ym;  %generates a random no. use to randomly distibutes nodes on y axis
    YR(i)=S(i).yd;
    S(i).G=0; %node is elegible to become cluster head
    talha=rand*a;
    S(i).E=Eo*(1+talha);
    E(i)= S(i).E;
    A=A+talha;  
    Et=Et+E(i);  %estimating total energy of the network
    %initially there are no cluster heads only nodes
    S(i).type='N';
    figure(10)
    plot(S(i).xd,S(i).yd,'bo');
    text(S(i).xd+1,S(i).yd-0.5,num2str(i));
    title 'Node Deployment';
    xlabel 'X-Coordinate(m)';
    ylabel 'Y-Coordinate(m)';
    hold on;
end

d1=0.765*xm/2;  %distance between cluster head and base station
K=sqrt(0.5*n*do/pi)*xm/d1^2; %optimal no. of cluster heads
d2=xm/sqrt(2*pi*K);  %distance between cluster members and cluster head
Er=4000*(2*n*ETX+n*EDA+K*Emp*d1^4+n*Efs*d2^2);  %energy desipated in a round
S(n+1).xd=sink.x; %sink is a n+1 node, x-axis postion of a node
S(n+1).yd=sink.y; %sink is a n+1 node, y-axis postion of a node
countCHs=0;  %variable, counts the cluster head
cluster=1;  %cluster is initialized as 1
flag_first_dead=0; %flag tells the first node dead
flag_tenth_dead=0;  %flag tells the 10th node dead
flag_all_dead=0;  %flag tells all nodes dead
dead=0;  %dead nodes count initialized to 0
first_dead=0;
tenth_dead=0;
all_dead=0;
allive=n;
%counter for bit transmitted to Bases Station and to Cluster Heads
packets_TO_BS=0;
packets_TO_CH=0;
for r=0:1:rmax     
    r
  if(mod(r, round(1/P) )==0)
    for i=1:1:n
        S(i).G=0;
        S(i).cl=0;
    end
  end
Ea=Et*(1-r/rmax)/n;
dead=0;
for i=1:1:n
   
    if (S(i).E<=0)
        dead=dead+1; 
        if (dead==1)
           if(flag_first_dead==0)
              first_dead=r;
              flag_first_dead=1;
           end
        end
        if(dead==0.1*n)
           if(flag_tenth_dead==0)
              tenth_dead=r;
              flag_tenth_dead=1;
           end
        end
        if(dead==n)
           if(flag_all_dead==0)
              all_dead=r;
              flag_all_dead=1;
           end
        end
    end
    if S(i).E>0
        S(i).type='N';
    end
end

sub plot , tiled , layout figure ,multiple axes , Matlab

Expert Answer

Prashant Kumar answered . 2024-09-18 18:32:58

> I want to plot two graphs in one figure
Options are
  • subplot
  • tiledlayout with nexttile - preferred, starting in R2019b
subplot(m,n,i) creates an axes in the i^th position of an m-by-n grid.
tiledlayout(m,n) creates an m-by-n grid upon which axes can be added using nexttile.
See documentation links for details.
Benefits to using tiledlayout
The following features are great improvements available in tiledlayout.
  1. Flexible grid sizes (TileArrangment property)
  2. Control spacing (TileSpacing and Padding properties, Community Highlight)
  3. Row-wise or column-wise order of axes (TileIndexing property, Community Highlight)
  4. Global labels such as a title, subtitle, xlabel and ylabel (labels properties)
  5. Global legends, starting in R2020b (legend layout property, documentation example, more demos)
  6. Global colorbars, starting in R2020b (colorbar layout property, documentation example, demo)
  7. Specify the span of an axes within the grid using nexttile(span)
Demo
 
 
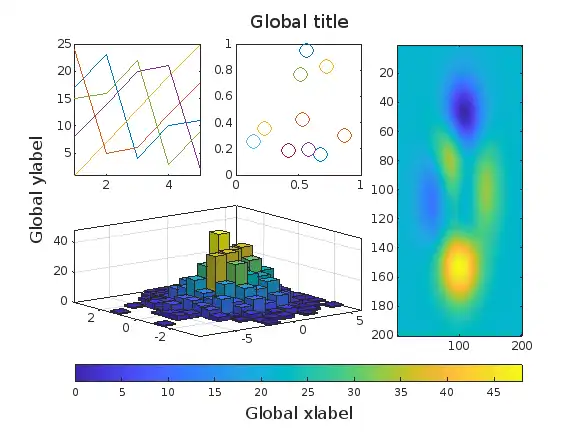
tcl = tiledlayout(2,3,'TileSpacing','compact');

nexttile
plot(magic(5))
axis tight

nexttile
scatter(rand(1,10), rand(1,10), 90, lines(10))
box on

nexttile([2,1])
imagesc(peaks(200))

nexttile([1,2])
histogram2(2*randn(1,1000), randn(1,1000), 'FaceColor', 'Flat')
cb = colorbar();
cb.Layout.Tile = 'south';

title(tcl, 'Global title')
xlabel(tcl, 'Global xlabel')
ylabel(tcl, 'Global ylabel')


Not satisfied with the answer ?? ASK NOW

Frequently Asked Questions

MATLAB offers tools for real-time AI applications, including Simulink for modeling and simulation. It can be used for developing algorithms and control systems for autonomous vehicles, robots, and other real-time AI systems.

MATLAB Online™ provides access to MATLAB® from your web browser. With MATLAB Online, your files are stored on MATLAB Drive™ and are available wherever you go. MATLAB Drive Connector synchronizes your files between your computers and MATLAB Online, providing offline access and eliminating the need to manually upload or download files. You can also run your files from the convenience of your smartphone or tablet by connecting to MathWorks® Cloud through the MATLAB Mobile™ app.

Yes, MATLAB provides tools and frameworks for deep learning, including the Deep Learning Toolbox. You can use MATLAB for tasks like building and training neural networks, image classification, and natural language processing.

MATLAB and Python are both popular choices for AI development. MATLAB is known for its ease of use in mathematical computations and its extensive toolbox for AI and machine learning. Python, on the other hand, has a vast ecosystem of libraries like TensorFlow and PyTorch. The choice depends on your preferences and project requirements.

You can find support, discussion forums, and a community of MATLAB users on the MATLAB website, Matlansolutions forums, and other AI-related online communities. Remember that MATLAB's capabilities in AI and machine learning continue to evolve, so staying updated with the latest features and resources is essential for effective AI development using MATLAB.

Without any hesitation the answer to this question is NO. The service we offer is 100% legal, legitimate and won't make you a cheater. Read and discover exactly what an essay writing service is and how when used correctly, is a valuable teaching aid and no more akin to cheating than a tutor's 'model essay' or the many published essay guides available from your local book shop. You should use the work as a reference and should not hand over the exact copy of it.

Matlabsolutions.com provides guaranteed satisfaction with a commitment to complete the work within time. Combined with our meticulous work ethics and extensive domain experience, We are the ideal partner for all your homework/assignment needs. We pledge to provide 24*7 support to dissolve all your academic doubts. We are composed of 300+ esteemed Matlab and other experts who have been empanelled after extensive research and quality check.

Matlabsolutions.com provides undivided attention to each Matlab assignment order with a methodical approach to solution. Our network span is not restricted to US, UK and Australia rather extends to countries like Singapore, Canada and UAE. Our Matlab assignment help services include Image Processing Assignments, Electrical Engineering Assignments, Matlab homework help, Matlab Research Paper help, Matlab Simulink help. Get your work done at the best price in industry.