Question
I have an object of which there is a symmetrical pattern, i want to plot a line of symmetry and then determine the array co-ordinates of the boundary point of the that line of symmetry. For example consider below: How could i go about detecting the line of symmetry for the object?
Expert Answer

Neeta Dsouza
PhD Expert
Answered Oct 7, 2026
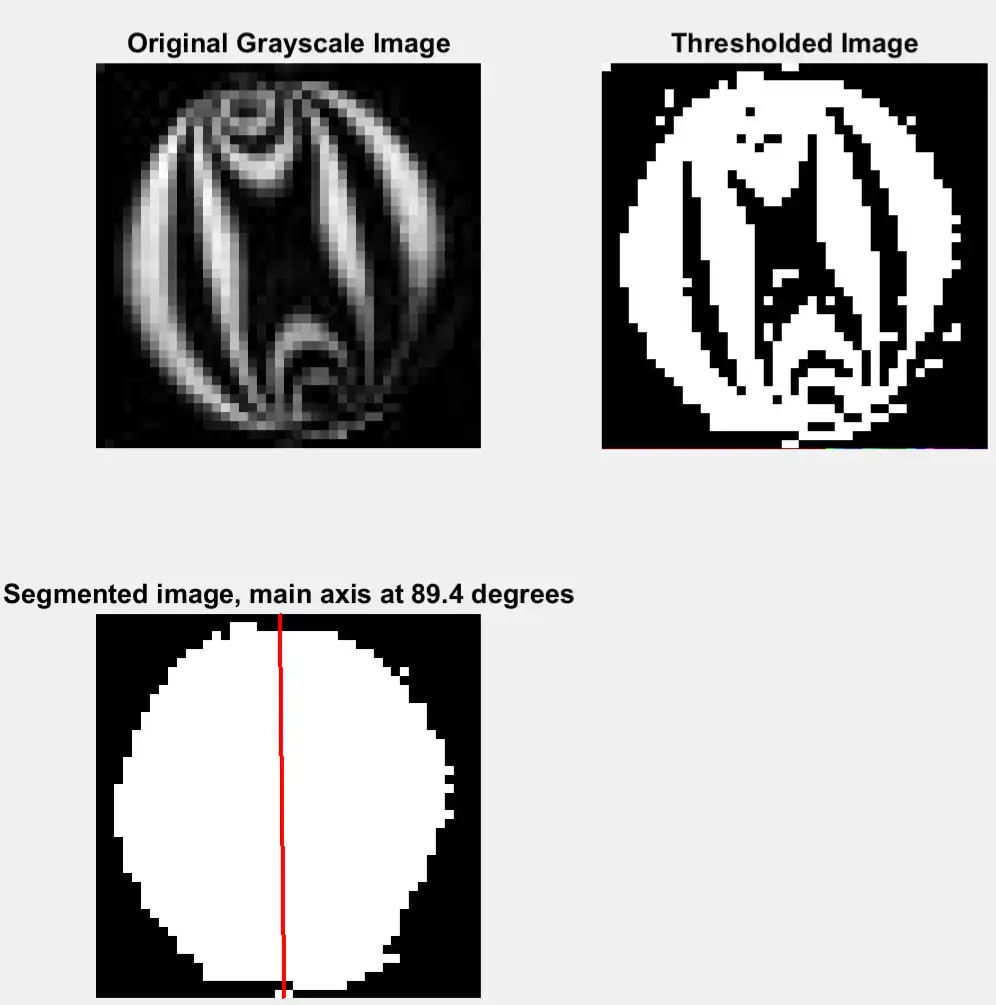
Try this code, below this image it creates.
% Read in a gray scale demo image.
folder = pwd;
baseFileName = 'cd.jpg';
% Get the full filename, with path prepended.
fullFileName = fullfile(folder, baseFileName);
% Check if file exists.
if ~exist(fullFileName, 'file')
	% The file doesn't exist -- didn't find it there in that folder.
	% Check the entire search path (other folders) for the file by stripping off the folder.
	fullFileNameOnSearchPath = baseFileName; % No path this time.
	if ~exist(fullFileNameOnSearchPath, 'file')
		% Still didn't find it.  Alert user.
		errorMessage = sprintf('Error: %s does not exist in the search path folders.', fullFileName);
		uiwait(warndlg(errorMessage));
		return;
	end
end
grayImage = imread(fullFileName);
% Get the dimensions of the image.
% numberOfColorChannels should be = 1 for a gray scale image, and 3 for an RGB color image.
[rows, columns, numberOfColorChannels] = size(grayImage);
if numberOfColorChannels > 1
	% It's not really gray scale like we expected - it's color.
	% Use weighted sum of ALL channels to create a gray scale image.
	grayImage = rgb2gray(grayImage);
	% ALTERNATE METHOD: Convert it to gray scale by taking only the green channel,
	% which in a typical snapshot will be the least noisy channel.
	% grayImage = grayImage(:, :, 2); % Take green channel.
end
% Display the image.
subplot(2, 2, 1);
imshow(grayImage, []);
title('Original Grayscale Image', 'FontSize', fontSize, 'Interpreter', 'None');

% Set up figure properties:
% Enlarge figure to full screen.
set(gcf, 'Units', 'Normalized', 'OuterPosition', [0 0 1 1]);
% Get rid of tool bar and pulldown menus that are along top of figure.
set(gcf, 'Toolbar', 'none', 'Menu', 'none');
% Give a name to the title bar.
set(gcf, 'Name', 'Demo by ImageAnalyst', 'NumberTitle', 'Off')

% Binarize the image
binaryImage = grayImage > 15;
% Display the image.
subplot(2, 2, 2);
imshow(binaryImage, []);
title('Thresholded Image', 'FontSize', fontSize, 'Interpreter', 'None');

% Extract the largest image and fill its holes.
binaryImage = bwareafilt(binaryImage, 1);
binaryImage = imfill(binaryImage, 'holes');
% Display the image.
subplot(2, 2, 3);
imshow(binaryImage, []);

% Get the centroid and orientation
labeledImage = bwlabel(binaryImage);
props = regionprops(labeledImage, 'Orientation', 'Centroid');
orientation = props.Orientation % Angle in degrees.
xCentroid = props.Centroid(1)
yCentroid = props.Centroid(2)
% Give title for the image.
caption = sprintf('Segmented image, main axis at %.1f degrees', orientation);
title(caption, 'FontSize', fontSize, 'Interpreter', 'None');

% Draw a line through the center at the centroid
x = 1 : columns;
slope = atand(orientation)
y = slope * (x - xCentroid) + yCentroid;
hold on;
plot(x, y, 'r-', 'LineWidth', 3);
100% Run Guarantee
3-Hour Fast-Track Delivery
Need a Custom Version or Complete Simulation for This Problem?
Our 500+ PhD engineers build, debug, and optimize working MATLAB scripts and Simulink (.slx) models tailored to your exact assignment rubrics with zero plagiarism.
Tested on MATLAB R2024b / R2026a
Turnitin 0% Plagiarism Report
Free 7-Day Revisions Guarantee
Have a different question? Ask here
Related image analysis Questions & Solutions
Browse All →
Explore similar technical troubleshooting questions and verified MATLAB solutions:
Ready-to-Run MATLAB & Simulink Projects
Browse All Projects →