Question
Hi everyone..... could anyone help...... I need to find th optimal value of x0 and x1 to maximize R, where x1=d-x0..........the function MATLAB code: close all; clear all; clc; % System parameters F = 10000; % Number of files S = 100; % SBS cache capacity (set to 100) M = 50; % Cash capacity fraction alpha = 2; % Path loss exponent for LOS link c = 3e8; % Light speed fr = 1e12; % Operating frequency B = 10e6; % System bandwidth epsilon = 0.8; % Skewness factor K = 0.0016; % Molecular absorption coefficient P_M = 10^(64/10); % Transmit power MBS P_S = 10^(30/10); % Transmit power SBS sigma = 10^(-90/10); % Noise power N_L = 512; N_M = 16; eta = 1; x2 =30; % RIS-MBS distance d_range = 1:1:40; R = zeros(size(d_range)); for i = 1:length(d_range) d = d_range(i); sum1 = 0; for f = 1:F sum1 = sum1 + f^(-epsilon); end sum2 = 0; for f = 1:M sum2 = sum2 + f^(-epsilon)/sum1; end sum3 = 0; for f = (M + 1):(M + (S - M) / eta) sum3 = sum3 + (f^(-epsilon)) / sum1; end sum3 = sum3 * eta; beta = (c/(4*pi*fr))^2; % Spreading loss index Rs = B * log2(1 + (P_S * beta * (d-x1)^(-alpha) * exp(-K * (d-x1))) / sigma); Rm = B * log2(1 + (P_M * (N_L^2) * N_M * (beta * (d-x0)^(-alpha) * exp(-K * (d-x0))) * (beta * x2^(-alpha) * exp(-K * x2))) / sigma); Rt = Rs * (sum2 + sum3) + Rm * (1 - (sum2 + sum3)); R(i) = Rt; end figure plot(d_range, R, 'b^-') xlabel('SBS-RIS Distance, d') ylabel('Achievable Rate')
Expert Answer

John Williams
PhD Expert
Answered Oct 11, 2026
Hi
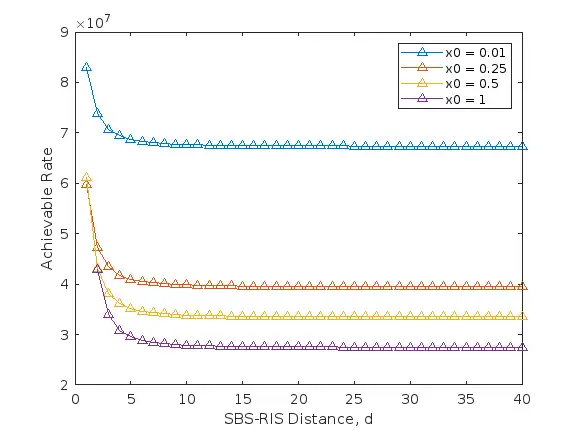
seems to me that R curves goes up as x0 goes closer to zero (but not rqual to zero otherwise you get Inf values)
also all the small for loops to create the sum1, sum2,sum3 variables can be replaced with sum function directly
close all; clear all; clc;

x0_range  = [0.01 0.25 0.5 1];

% System parameters
F = 10000;    % Number of files
S = 100;     % SBS cache capacity (set to 100)
M = 50;      % Cash capacity fraction
alpha = 2; % Path loss exponent for LOS link
c = 3e8;     % Light speed
fr = 1e12;  % Operating frequency
B = 10e6;    % System bandwidth
epsilon = 0.8; % Skewness factor
K = 0.0016;  % Molecular absorption coefficient
P_M = 10^(64/10); % Transmit power MBS
P_S = 10^(30/10); % Transmit power SBS
sigma = 10^(-90/10); % Noise power
N_L = 512;
N_M = 16;
eta = 1;
x2 =30;      % RIS-MBS distance
d_range = 1:1:40;

R = zeros(numel(d_range),numel(x0_range));

for k = 1:numel(x0_range)
    x0 = x0_range(k);

    for i = 1:length(d_range)
        d = d_range(i);
        x1 = d-x0; % added line

%         sum1 = 0;
%         for f = 1:F
%             sum1 = sum1 + f^(-epsilon);
%         end
        f = 1:F;
        sum1 = sum(f.^(-epsilon));

%         sum2 = 0;
%         for f = 1:M
%             sum2 = sum2 + f^(-epsilon)/sum1;
%         end

        f = 1:M;
        sum2 = sum(f.^(-epsilon))/sum1;

%         sum3 = 0;
%         for f = (M + 1):(M + (S - M) / eta)
%             sum3 = sum3 + (f^(-epsilon)) / sum1;
%         end
%         sum3 = sum3 * eta;

        f = (M + 1):(M + (S - M) / eta);
        sum3 = eta*sum(f.^(-epsilon))/sum1;


        beta = (c/(4*pi*fr))^2;  % Spreading loss index
        Rs = B * log2(1 + (P_S * beta * (d-x1)^(-alpha) * exp(-K * (d-x1))) / sigma);
        Rm = B * log2(1 + (P_M * (N_L^2) * N_M * (beta * (d-x0)^(-alpha) * exp(-K * (d-x0))) * (beta * x2^(-alpha) * exp(-K * x2))) / sigma);
        Rt = Rs * (sum2 + sum3) + Rm * (1 - (sum2 + sum3));
        R(i,k) = Rt;
        leg{k} = ['x0 = ' num2str(x0)];

    end

end

    plot(d_range, R, '^-')
    legend(leg)
    xlabel('SBS-RIS Distance, d')
    ylabel('Achievable Rate')
100% Run Guarantee
3-Hour Fast-Track Delivery
Need a Custom Version or Complete Simulation for This Problem?
Our 500+ PhD engineers build, debug, and optimize working MATLAB scripts and Simulink (.slx) models tailored to your exact assignment rubrics with zero plagiarism.
Tested on MATLAB R2024b / R2026a
Turnitin 0% Plagiarism Report
Free 7-Day Revisions Guarantee
Have a different question? Ask here
Related optimization Questions & Solutions
Browse All →
Explore similar technical troubleshooting questions and verified MATLAB solutions:
Ready-to-Run MATLAB & Simulink Projects
Browse All Projects →