Question
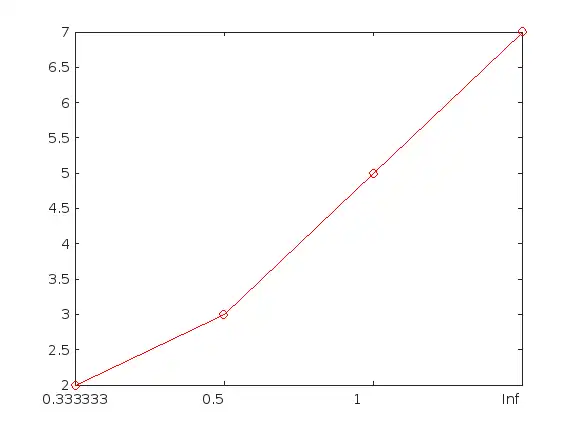
Hello, I am attempting to replicate the following plot in a textbook using my own numerical solver. I am having trouble with replicating the x-axis in the plot for comparison since it is a bit odd. See the axes below: I am aware that you can use Xtick to choose where ticks are located, but this does not affect the spacing of the ticks such that they are equally spaced like in the example above. The closest I am able to get is shown below: Log scaling does slightly better, but is still not evenly spaced like I would hope: Unfortunately I have not been able to find a way to change the scaling to be something other than linear or log. I am using MATLAB R2023a. Does anyone know a way to create the evently spaced type of scaling seen in the first set of axes?
Expert Answer

Kshitij Singh
PhD Expert
Answered Oct 7, 2026
You could not plot versus the numbers 0,1,2,3, but then set the x-tick labels as you wish?
x = [1/3 1/2 1 inf];
xfake = [0 1 2 3];

y = [2 3 5 7];

plot(xfake,y,'-or')
set(gca,Xtick = [0 1 2 3],XTickLabel = x)
100% Run Guarantee
3-Hour Fast-Track Delivery
Need a Custom Version or Complete Simulation for This Problem?
Our 500+ PhD engineers build, debug, and optimize working MATLAB scripts and Simulink (.slx) models tailored to your exact assignment rubrics with zero plagiarism.
Tested on MATLAB R2024b / R2026a
Turnitin 0% Plagiarism Report
Free 7-Day Revisions Guarantee
Have a different question? Ask here
Related MATLAB Questions & Solutions
Browse All →
Explore similar technical troubleshooting questions and verified MATLAB solutions:
Ready-to-Run MATLAB & Simulink Projects
Browse All Projects →