Question
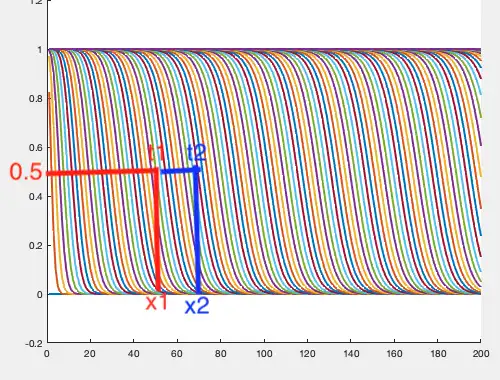
Hi everyone, I have a travelling wave solution drawn at each time step for a set of data obtained from a previous simulation. Tmax = 10000; m =load('solution.mat'); SS = m.sol; N = m.N1; for i = 1:50:Tmax Xval = SS(i,N); hold on plot(N,Xval,'Linewidth',2); end hold off and below is the out put I got from the above code where x axis represents a distance (N) from 0 to 200 and y axis takes values between 0-1. .Each coloured line is drawn at a different time step. Next, I'd like to calculate the velocity at each time step when y=0.5. I.e. I want to identify the x value when y=0.5 for each colour line and calculate the velocity as . The main question here is sometimes there are no exact points in Xval with value 0.5 or no exact N value associated to 0.5. I'd be happy if someone could help me in creating a loop for this calculation.
Expert Answer

Prashant Kumar
PhD Expert
Answered Oct 20, 2026
A simple intersection approach works —
t = linspace(0, 25, 450);
x = sin(2*pi*t+rand(size(t)))/2+0.5;
L = numel(t);
xval = 0.5;
tidx = find(diff(sign(x-xval)));                        % Approimate Intersections
for k = 1:numel(tidx)
    idxrng = max(1,tidx(k)-1) : min(tidx(k)+1,L);
    tv(k,:) = interp1(x(idxrng), t(idxrng), xval);      % Exact Interseections
end
xv = ones(size(tv)) * xval;
Velocity = 1 ./ diff(tv);
Results = table(tv(2:end), Velocity, 'VariableNames',{'Time','Velocity'})
Results = 61×2 table
     Time      Velocity
    _______    ________

    0.86599     2.0118
     1.4494     1.7142
     1.9056     2.1916
     2.4067     1.9959
     2.8642     2.1857
     3.3668     1.9895
     3.8813     1.9438
     4.3854     1.9837
     4.8913     1.9769
     5.4618     1.7527
     5.8731     2.4316
     6.4307     1.7934
     6.8758     2.2465
     7.3968     1.9195
     7.8853     2.0469
     8.3841     2.0048
figure
plot(t, x, 'DisplayName','Original Data')
hold on
plot(tv, xv, 'xr', 'DisplayName','Exact Intersections')
hold off
grid
legend('Location','best')
100% Run Guarantee
3-Hour Fast-Track Delivery
Need a Custom Version or Complete Simulation for This Problem?
Our 500+ PhD engineers build, debug, and optimize working MATLAB scripts and Simulink (.slx) models tailored to your exact assignment rubrics with zero plagiarism.
Tested on MATLAB R2024b / R2026a
Turnitin 0% Plagiarism Report
Free 7-Day Revisions Guarantee
Have a different question? Ask here
Related velocity Questions & Solutions
Browse All →
Explore similar technical troubleshooting questions and verified MATLAB solutions:
Ready-to-Run MATLAB & Simulink Projects
Browse All Projects →